Dividend Data
Transform your spreadsheets into a powerful investment terminal with instant stock data and decades of history.
AI tool Details
Explore More
Alternatives

About Dividend Data
Stop wasting hours on manual data entry and fragmented research. Dividend Data is your ultimate financial empowerment tool, designed to transform how you analyze and invest in the stock market. This powerful platform brings institutional-grade financial data directly into the spreadsheets you already use and love—Google Sheets and Microsoft Excel. Imagine having over 30 years of historical data for more than 80,000 global tickers at your fingertips, accessible not through complex APIs or endless copying and pasting, but through simple, intuitive custom formulas. Built by a dividend investor for dividend investors, it provides instant, live access to critical metrics like dividends, yields, payout ratios, growth rates, complete financial statements, earnings, valuation ratios, and price history. The mission is clear: to democratize high-quality financial data. Whether you're a fundamental investor building a retirement portfolio, a financial analyst creating models, or an enthusiast tracking your holdings, Dividend Data gives you the power to make informed, confident decisions without the institutional price tag. Start with a generous free tier that never expires and step into a world where your analysis is limited only by your curiosity, not by data access.
Features
Comprehensive Spreadsheet Integration
Unlock the full potential of your investment analysis without ever leaving your workflow. Dividend Data seamlessly integrates with both Google Sheets and Microsoft Excel through dedicated add-ins. Simply install the tool and gain access to 16 powerful custom functions that pull live data directly into your cells. Type a formula like =DIVIDENDDATA_DIVIDENDS("MSFT") and watch as the forward annual dividend, yield, or ex-date instantly appears. This feature eliminates manual errors, saves countless hours, and keeps your models dynamically connected to the markets.
Deep Historical & Fundamental Data Library
Go beyond surface-level quotes with a deep dive into decades of financial history. Access over 30 years of meticulously organized data for dividends, stock prices, and full financial statements (income, balance sheet, cash flow). This extensive library includes more than 100 key metrics such as PE ratios, EPS, revenue growth, and debt-to-equity ratios. This depth allows you to perform robust trend analysis, calculate long-term growth rates, and build valuation models with confidence, all from within your spreadsheet.
Built-for-Investor Function Suite
This tool is engineered with the specific needs of income and fundamental investors in mind. The custom formulas are designed to fetch exactly what you need. Quickly retrieve the next ex-dividend date, analyze the dividend payout ratio for safety, calculate the five-year dividend growth rate, or compare current yields. This targeted approach means you spend less time wrestling with data and more time executing your investment strategy, armed with precise and actionable information.
Free Tier with Generous Access
Begin your transformation with zero risk and no barriers. Dividend Data offers a permanently free tier that provides 2,500 credits every month, with no trial period expiration. This allows you to thoroughly test the platform, build spreadsheets, and perform significant analysis without ever entering a credit card. It’s a testament to the commitment of empowering all investors, providing professional-grade tools to help you start making smarter decisions today.
Use Cases
Automated Dividend Portfolio Tracking
Transform a tedious chore into an automated, insightful dashboard. Connect your portfolio holdings to live data feeds to automatically track dividend payment dates, yields, and income projections. Create a master sheet that updates in real-time, showing your estimated annual income, dividend growth trends, and portfolio yield. This automation empowers you to manage your income stream proactively and make timely reinvestment decisions.
Fundamental Stock Analysis & Screening
Conduct deep, fundamental research to uncover high-quality stocks. Use the historical data and financial ratios to screen for companies with strong balance sheets, consistent earnings growth, and sustainable dividend policies. Compare key metrics across sectors or build a discounted cash flow (DCF) model using live data inputs. This use case turns your spreadsheet into a powerful research terminal, helping you identify promising investment opportunities before the crowd.
Financial Modeling & Forecasting
Build dynamic, data-driven financial models for any public company. Pull in ten years of historical income statements, balance sheets, and cash flow statements directly into your Excel model. Use this data to project future revenues, earnings, and free cash flow, creating robust valuations. Because the data updates live, your models remain current, allowing for continuous monitoring and adjustment of your investment theses.
Educational Research & Learning
Accelerate your investment education by working with real market data. Students and new investors can use the free tier to practice calculating financial ratios, understanding dividend timelines, and analyzing company performance over economic cycles. This hands-on experience with professional tools and actual data builds practical skills and confidence far faster than theoretical study alone.
Frequently Asked Questions
How does the free tier work and what are credits?
The free tier provides 2,500 credits each month, renewed automatically, with no expiration date. Credits are consumed each time you use a Dividend Data formula in your spreadsheet. For example, fetching a single data point like a current price or dividend yield typically uses one credit. This generous allowance allows for substantial monthly analysis, perfect for individual investors tracking a portfolio or conducting regular research without any cost.
Do I need an API key or coding knowledge to use it?
Absolutely not. Dividend Data is designed for simplicity and accessibility. There are no API keys to manage and zero coding required. After installing the add-in for Google Sheets or Microsoft Excel, you simply use the pre-built custom formulas just like any native spreadsheet function. The complexity is handled behind the scenes, delivering powerful data with a user-friendly experience.
What kind of data can I access with the spreadsheet functions?
You can access a vast array of data points crucial for investment analysis. This includes dividend information (amount, yield, ex-date, growth rate), real-time quotes, over 30 years of historical prices, complete financial statements (revenue, net income, assets, liabilities), and key valuation and profitability ratios (P/E, P/B, ROE, debt-to-equity). The functions are built to deliver specific metrics directly to your cell.
Is my data and portfolio information secure?
Yes. Dividend Data operates with a strong commitment to user privacy and security. Your spreadsheet data and portfolio lists remain within your Google or Microsoft ecosystem. The add-in fetches public market data but does not store or have access to the personal content of your spreadsheets. You maintain full control and ownership of your financial models and analysis at all times.
Similar to Dividend Data


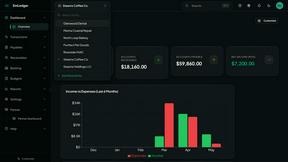
EmLedger
Stop paying per entity and finally run real double-entry accounting across every LLC and property from one unified ledger.

Notesnchat
Transform your scattered daily life into organized productivity with Notesnchat’s all-in-one app for reminders, notes, tasks, and communication.