Dividend Data vs MonsterOps
Side-by-side comparison to help you choose the right AI tool.
Dividend Data
Transform your spreadsheets into a powerful investment terminal with instant stock data and decades of history.
Last updated: March 11, 2026
MonsterOps
See any amount of money as realistic 3D stacks to truly visualize its scale.
Last updated: March 1, 2026
Visual Comparison
Dividend Data

MonsterOps
Feature Comparison
Dividend Data
Comprehensive Spreadsheet Integration
Unlock the full potential of your investment analysis without ever leaving your workflow. Dividend Data seamlessly integrates with both Google Sheets and Microsoft Excel through dedicated add-ins. Simply install the tool and gain access to 16 powerful custom functions that pull live data directly into your cells. Type a formula like =DIVIDENDDATA_DIVIDENDS("MSFT") and watch as the forward annual dividend, yield, or ex-date instantly appears. This feature eliminates manual errors, saves countless hours, and keeps your models dynamically connected to the markets.
Deep Historical & Fundamental Data Library
Go beyond surface-level quotes with a deep dive into decades of financial history. Access over 30 years of meticulously organized data for dividends, stock prices, and full financial statements (income, balance sheet, cash flow). This extensive library includes more than 100 key metrics such as PE ratios, EPS, revenue growth, and debt-to-equity ratios. This depth allows you to perform robust trend analysis, calculate long-term growth rates, and build valuation models with confidence, all from within your spreadsheet.
Built-for-Investor Function Suite
This tool is engineered with the specific needs of income and fundamental investors in mind. The custom formulas are designed to fetch exactly what you need. Quickly retrieve the next ex-dividend date, analyze the dividend payout ratio for safety, calculate the five-year dividend growth rate, or compare current yields. This targeted approach means you spend less time wrestling with data and more time executing your investment strategy, armed with precise and actionable information.
Free Tier with Generous Access
Begin your transformation with zero risk and no barriers. Dividend Data offers a permanently free tier that provides 2,500 credits every month, with no trial period expiration. This allows you to thoroughly test the platform, build spreadsheets, and perform significant analysis without ever entering a credit card. It’s a testament to the commitment of empowering all investors, providing professional-grade tools to help you start making smarter decisions today.
MonsterOps
Unified Business Workspace
MonsterOps eliminates tool sprawl by consolidating your entire operation into one intuitive platform. Say goodbye to juggling between spreadsheets for goals, documents for notes, and separate apps for tasks. This single source of truth brings your strategy, execution, and accountability together, providing a holistic view of your business health and ensuring nothing falls through the cracks.
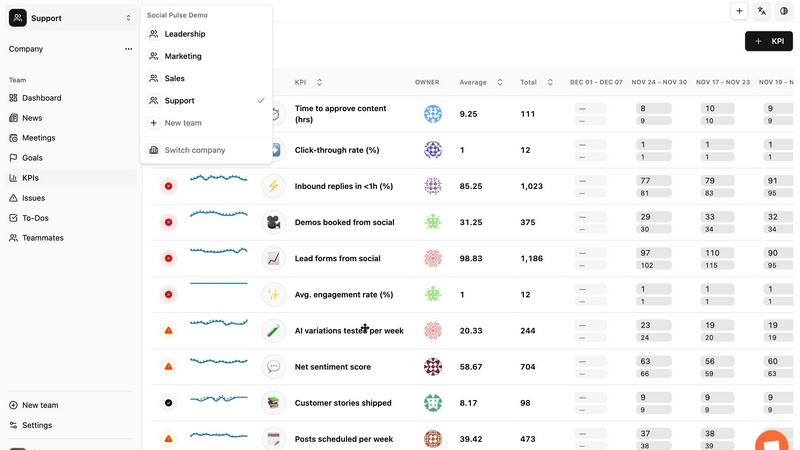
Real-Time KPI & Scorecard Tracking
Gain instant, crystal-clear visibility into your business's vital signs with dynamic scorecards. Monitor key performance indicators in real-time, allowing you to make data-driven decisions quickly. This feature transforms guesswork into informed leadership, helping you celebrate wins, identify risks early, and keep your entire team laser-focused on the metrics that truly matter for growth.
Structured Meeting & Agenda Management
Banish unproductive, meandering meetings forever. MonsterOps provides built-in, structured agendas for all critical meeting types—from weekly team syncs to quarterly planning sessions. It automates check-ins, tracks action items, and archives decisions, ensuring every meeting is purposeful, efficient, and drives tangible outcomes that propel your business forward.
Customizable Operating Playbooks
Whether you follow EOS, Scaling Up, or your own unique methodology, MonsterOps adapts to you. The platform is designed to flexibly support any business operating system. You can customize workflows, terminology, and processes to match your established playbook, ensuring a smooth adoption that enhances your existing structure rather than forcing a disruptive change.
Use Cases
Dividend Data
Automated Dividend Portfolio Tracking
Transform a tedious chore into an automated, insightful dashboard. Connect your portfolio holdings to live data feeds to automatically track dividend payment dates, yields, and income projections. Create a master sheet that updates in real-time, showing your estimated annual income, dividend growth trends, and portfolio yield. This automation empowers you to manage your income stream proactively and make timely reinvestment decisions.
Fundamental Stock Analysis & Screening
Conduct deep, fundamental research to uncover high-quality stocks. Use the historical data and financial ratios to screen for companies with strong balance sheets, consistent earnings growth, and sustainable dividend policies. Compare key metrics across sectors or build a discounted cash flow (DCF) model using live data inputs. This use case turns your spreadsheet into a powerful research terminal, helping you identify promising investment opportunities before the crowd.
Financial Modeling & Forecasting
Build dynamic, data-driven financial models for any public company. Pull in ten years of historical income statements, balance sheets, and cash flow statements directly into your Excel model. Use this data to project future revenues, earnings, and free cash flow, creating robust valuations. Because the data updates live, your models remain current, allowing for continuous monitoring and adjustment of your investment theses.
Educational Research & Learning
Accelerate your investment education by working with real market data. Students and new investors can use the free tier to practice calculating financial ratios, understanding dividend timelines, and analyzing company performance over economic cycles. This hands-on experience with professional tools and actual data builds practical skills and confidence far faster than theoretical study alone.
MonsterOps
Implementing the Entrepreneurial Operating System (EOS)
For businesses adopting EOS, MonsterOps is the ultimate digital toolkit. It seamlessly incorporates the core EOS components—the Vision/Traction Organizer, Scorecards, Meeting Pulses, and Issues List—into a streamlined digital workflow. This accelerates implementation, strengthens discipline, and provides the real-time connectivity needed to truly master the EOS framework and achieve traction.
Leading Effective Leadership Team Meetings
Transform your leadership team meetings from chaotic updates to strategic power sessions. MonsterOps provides the agenda, scorecard data, and issues list in one place before the meeting even starts. This ensures discussions are focused on solving the right problems, reviewing real data, and making decisive commitments, dramatically increasing leadership alignment and execution speed.
Gaining Company-Wide Strategic Alignment
Break down silos and create a culture of unified focus. By making company goals, departmental priorities, and team scorecards visible to everyone in MonsterOps, you ensure every employee understands how their work contributes to the bigger picture. This transparency builds accountability and empowers teams to move decisively toward shared strategic objectives.
Scaling Operations Predictably
As you grow, operational complexity can become your biggest enemy. MonsterOps provides the scalable structure needed to manage growth without chaos. It systematizes your core processes, maintains visibility as teams expand, and ensures your operating rhythm remains strong. This allows founders to scale their business with confidence, not confusion.
Overview
About Dividend Data
Stop wasting hours on manual data entry and fragmented research. Dividend Data is your ultimate financial empowerment tool, designed to transform how you analyze and invest in the stock market. This powerful platform brings institutional-grade financial data directly into the spreadsheets you already use and love—Google Sheets and Microsoft Excel. Imagine having over 30 years of historical data for more than 80,000 global tickers at your fingertips, accessible not through complex APIs or endless copying and pasting, but through simple, intuitive custom formulas. Built by a dividend investor for dividend investors, it provides instant, live access to critical metrics like dividends, yields, payout ratios, growth rates, complete financial statements, earnings, valuation ratios, and price history. The mission is clear: to democratize high-quality financial data. Whether you're a fundamental investor building a retirement portfolio, a financial analyst creating models, or an enthusiast tracking your holdings, Dividend Data gives you the power to make informed, confident decisions without the institutional price tag. Start with a generous free tier that never expires and step into a world where your analysis is limited only by your curiosity, not by data access.
About MonsterOps
Are you a founder or leadership team member who feels like you're constantly putting out fires instead of fueling your company's growth? You're not alone. The chaos of managing a growing business with a patchwork of spreadsheets, documents, and disconnected apps is a universal struggle that steals your focus and stifles your potential. MonsterOps is your definitive solution. It is the Business Operating System (BOS) designed to transform that operational chaos into predictable, scalable growth. This powerful platform provides a single, unified command center for your entire business, seamlessly integrating your goals, meetings, performance scorecards, and critical issues into one coherent, actionable system. Built for small to mid-sized businesses, MonsterOps is the perfect engine for teams implementing proven frameworks like the Entrepreneurial Operating System (EOS) or Scaling Up, yet remains beautifully flexible for any custom operating playbook. By delivering real-time KPI visibility, automating routine check-ins, and providing structured meeting agendas, MonsterOps creates unparalleled alignment. It ensures every team member is rowing in the same direction with clarity and purpose, finally empowering leaders to step out of the daily disarray and lead their business forward with confidence and control.
Frequently Asked Questions
Dividend Data FAQ
How does the free tier work and what are credits?
The free tier provides 2,500 credits each month, renewed automatically, with no expiration date. Credits are consumed each time you use a Dividend Data formula in your spreadsheet. For example, fetching a single data point like a current price or dividend yield typically uses one credit. This generous allowance allows for substantial monthly analysis, perfect for individual investors tracking a portfolio or conducting regular research without any cost.
Do I need an API key or coding knowledge to use it?
Absolutely not. Dividend Data is designed for simplicity and accessibility. There are no API keys to manage and zero coding required. After installing the add-in for Google Sheets or Microsoft Excel, you simply use the pre-built custom formulas just like any native spreadsheet function. The complexity is handled behind the scenes, delivering powerful data with a user-friendly experience.
What kind of data can I access with the spreadsheet functions?
You can access a vast array of data points crucial for investment analysis. This includes dividend information (amount, yield, ex-date, growth rate), real-time quotes, over 30 years of historical prices, complete financial statements (revenue, net income, assets, liabilities), and key valuation and profitability ratios (P/E, P/B, ROE, debt-to-equity). The functions are built to deliver specific metrics directly to your cell.
Is my data and portfolio information secure?
Yes. Dividend Data operates with a strong commitment to user privacy and security. Your spreadsheet data and portfolio lists remain within your Google or Microsoft ecosystem. The add-in fetches public market data but does not store or have access to the personal content of your spreadsheets. You maintain full control and ownership of your financial models and analysis at all times.
MonsterOps FAQ
What is a Business Operating System (BOS)?
A Business Operating System is a complete set of tools, processes, and principles that align your entire organization around a shared vision and strategy. It's the "how" behind your "what." MonsterOps is the digital embodiment of a BOS, providing the unified platform to execute your chosen framework, track progress with data, and manage the daily and quarterly rhythms that drive predictable growth.
Is MonsterOps only for companies using EOS or Scaling Up?
Absolutely not. While MonsterOps is expertly designed to support popular frameworks like EOS and Scaling Up with built-in templates and workflows, its core strength is flexibility. The platform can be fully customized to support any operating playbook or management methodology your company uses, making it the perfect central hub for any business seeking more structure and alignment.
How does MonsterOps improve team accountability?
MonsterOps creates natural accountability by making goals, metrics, and commitments highly visible and transparent. With clear scorecards, structured meeting outcomes, and tracked action items, everyone knows who is responsible for what and by when. This visibility, combined with the platform's meeting rhythms, ensures follow-through and turns promises into results.
Can we integrate MonsterOps with our other tools?
MonsterOps is designed as a comprehensive, all-in-one workspace to reduce dependency on disconnected tools. Its unified approach consolidates the core functions of strategy, meetings, and performance tracking. For the best experience and to achieve a single source of truth, the platform is built to be your primary operating system, minimizing the need for complex integrations that can recreate the very chaos it solves.
Alternatives
Dividend Data Alternatives
Dividend Data is a specialized financial data tool designed for investors who prioritize dividends and fundamental analysis. It delivers over three decades of market data directly into spreadsheets through simple formulas, eliminating the need for complex coding or manual updates. This places it in the category of self-service investment research platforms built for individual investors. Users often explore alternatives for various reasons, such as seeking different pricing models, requiring specific data points not covered, or needing integration with other platforms. Your unique investment strategy, budget, and technical comfort level will guide your search for the right tool. When evaluating options, focus on the depth and reliability of historical data, the simplicity of accessing it within your workflow, and the overall value. The best solution empowers your process without creating new obstacles, giving you more time for analysis and decision-making.
MonsterOps Alternatives
MonsterOps is a powerful Business Operating System (BOS) designed to bring order and clarity to small and mid-sized businesses. It falls into the productivity and management category, acting as a unified command center to replace scattered tools and processes. Business leaders often explore alternatives for various reasons. This could be due to specific budget constraints, the need for a platform that integrates with a unique tech stack, or a desire for features tailored to a very specific management methodology. It's a natural part of finding the perfect operational fit for your company's growth stage and culture. When evaluating options, focus on solutions that genuinely unify your operations rather than adding another siloed tool. Look for a system that provides real-time visibility into performance, structures accountability, and adapts to your company's unique rhythm. The right platform should make your strategic execution effortless and transparent, empowering your team to move forward with confidence.