Dividend Data vs GrowPanel
Side-by-side comparison to help you choose the right AI tool.
Dividend Data
Transform your spreadsheets into a powerful investment terminal with instant stock data and decades of history.
Last updated: March 11, 2026
GrowPanel
GrowPanel empowers SaaS businesses with real-time analytics for MRR, churn, and LTV to drive smarter growth.
Last updated: February 26, 2026
Visual Comparison
Dividend Data

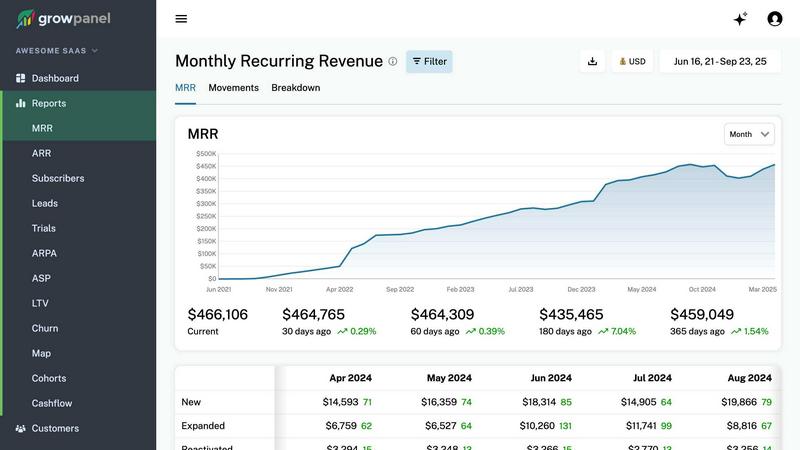
GrowPanel
Feature Comparison
Dividend Data
Comprehensive Spreadsheet Integration
Unlock the full potential of your investment analysis without ever leaving your workflow. Dividend Data seamlessly integrates with both Google Sheets and Microsoft Excel through dedicated add-ins. Simply install the tool and gain access to 16 powerful custom functions that pull live data directly into your cells. Type a formula like =DIVIDENDDATA_DIVIDENDS("MSFT") and watch as the forward annual dividend, yield, or ex-date instantly appears. This feature eliminates manual errors, saves countless hours, and keeps your models dynamically connected to the markets.
Deep Historical & Fundamental Data Library
Go beyond surface-level quotes with a deep dive into decades of financial history. Access over 30 years of meticulously organized data for dividends, stock prices, and full financial statements (income, balance sheet, cash flow). This extensive library includes more than 100 key metrics such as PE ratios, EPS, revenue growth, and debt-to-equity ratios. This depth allows you to perform robust trend analysis, calculate long-term growth rates, and build valuation models with confidence, all from within your spreadsheet.
Built-for-Investor Function Suite
This tool is engineered with the specific needs of income and fundamental investors in mind. The custom formulas are designed to fetch exactly what you need. Quickly retrieve the next ex-dividend date, analyze the dividend payout ratio for safety, calculate the five-year dividend growth rate, or compare current yields. This targeted approach means you spend less time wrestling with data and more time executing your investment strategy, armed with precise and actionable information.
Free Tier with Generous Access
Begin your transformation with zero risk and no barriers. Dividend Data offers a permanently free tier that provides 2,500 credits every month, with no trial period expiration. This allows you to thoroughly test the platform, build spreadsheets, and perform significant analysis without ever entering a credit card. It’s a testament to the commitment of empowering all investors, providing professional-grade tools to help you start making smarter decisions today.
GrowPanel
Real-time MRR, ARR, Churn, and LTV Tracking
Stay on top of your subscription metrics with real-time tracking of Monthly Recurring Revenue (MRR), Annual Recurring Revenue (ARR), churn rates, and Customer Lifetime Value (LTV). This feature provides a comprehensive overview of your financial health, enabling quick adjustments to your business strategies.
Trial Conversion and Cohort Analysis
Gain insights into trial users' behavior with detailed cohort analysis. This feature allows you to identify conversion patterns and optimize your onboarding processes, turning more trial users into paying customers effectively and efficiently.
Revenue Segmentation by Various Attributes
Understand your revenue streams better by segmenting data by plan, country, currency, or custom attributes. This feature enables you to pinpoint which segments are performing well and where there might be opportunities for growth or improvement.
AI Chat to Query Your Metrics
With GrowPanel's AI chat feature, you can interact with your data using plain language. Simply ask questions like "What is our churn rate this quarter?" and receive instant, comprehensible answers, making data accessibility a breeze for everyone on your team.
Use Cases
Dividend Data
Automated Dividend Portfolio Tracking
Transform a tedious chore into an automated, insightful dashboard. Connect your portfolio holdings to live data feeds to automatically track dividend payment dates, yields, and income projections. Create a master sheet that updates in real-time, showing your estimated annual income, dividend growth trends, and portfolio yield. This automation empowers you to manage your income stream proactively and make timely reinvestment decisions.
Fundamental Stock Analysis & Screening
Conduct deep, fundamental research to uncover high-quality stocks. Use the historical data and financial ratios to screen for companies with strong balance sheets, consistent earnings growth, and sustainable dividend policies. Compare key metrics across sectors or build a discounted cash flow (DCF) model using live data inputs. This use case turns your spreadsheet into a powerful research terminal, helping you identify promising investment opportunities before the crowd.
Financial Modeling & Forecasting
Build dynamic, data-driven financial models for any public company. Pull in ten years of historical income statements, balance sheets, and cash flow statements directly into your Excel model. Use this data to project future revenues, earnings, and free cash flow, creating robust valuations. Because the data updates live, your models remain current, allowing for continuous monitoring and adjustment of your investment theses.
Educational Research & Learning
Accelerate your investment education by working with real market data. Students and new investors can use the free tier to practice calculating financial ratios, understanding dividend timelines, and analyzing company performance over economic cycles. This hands-on experience with professional tools and actual data builds practical skills and confidence far faster than theoretical study alone.
GrowPanel
Enhancing Customer Retention
SaaS companies can utilize GrowPanel to monitor churn rates closely and identify factors that contribute to customer retention. By understanding why customers leave or stay, businesses can implement targeted strategies to enhance loyalty and reduce churn.
Optimizing Trial Conversions
GrowPanel's trial insights allow businesses to analyze user behavior during their trial period. By identifying trends and conversion patterns, companies can refine their strategies to convert more trial users into long-term subscribers, boosting overall revenue.
Cashflow Management
With detailed cashflow reporting, companies can track every dollar coming in and going out. This feature is crucial for understanding financial health, making informed decisions about spending, and projecting future cash positions accurately.
Real-time Performance Monitoring
Using GrowPanel, businesses can monitor their performance in real-time, enabling them to react swiftly to trends and anomalies. This proactive approach helps in making timely adjustments to marketing strategies and service offerings.
Overview
About Dividend Data
Stop wasting hours on manual data entry and fragmented research. Dividend Data is your ultimate financial empowerment tool, designed to transform how you analyze and invest in the stock market. This powerful platform brings institutional-grade financial data directly into the spreadsheets you already use and love—Google Sheets and Microsoft Excel. Imagine having over 30 years of historical data for more than 80,000 global tickers at your fingertips, accessible not through complex APIs or endless copying and pasting, but through simple, intuitive custom formulas. Built by a dividend investor for dividend investors, it provides instant, live access to critical metrics like dividends, yields, payout ratios, growth rates, complete financial statements, earnings, valuation ratios, and price history. The mission is clear: to democratize high-quality financial data. Whether you're a fundamental investor building a retirement portfolio, a financial analyst creating models, or an enthusiast tracking your holdings, Dividend Data gives you the power to make informed, confident decisions without the institutional price tag. Start with a generous free tier that never expires and step into a world where your analysis is limited only by your curiosity, not by data access.
About GrowPanel
GrowPanel is a groundbreaking subscription analytics platform specifically designed for Software as a Service (SaaS) companies seeking clarity and insight into their revenue metrics. By integrating seamlessly with billing platforms like Stripe, Chargebee, and Recurly, GrowPanel transforms complex data into insightful, real-time dashboards. This platform eliminates the chaos of managing spreadsheets, allowing businesses to focus on what truly matters: growth. With instant visibility into key metrics such as Monthly Recurring Revenue (MRR), Annual Recurring Revenue (ARR), churn rates, and customer retention, GrowPanel empowers SaaS businesses to make data-driven decisions confidently. The tool is tailored for entrepreneurs and teams eager to understand their financial health without the burden of manual calculations. With a commitment to transparency and efficiency, GrowPanel is your partner in navigating the ever-evolving subscription landscape, ensuring you have the insights you need to grow smarter and faster.
Frequently Asked Questions
Dividend Data FAQ
How does the free tier work and what are credits?
The free tier provides 2,500 credits each month, renewed automatically, with no expiration date. Credits are consumed each time you use a Dividend Data formula in your spreadsheet. For example, fetching a single data point like a current price or dividend yield typically uses one credit. This generous allowance allows for substantial monthly analysis, perfect for individual investors tracking a portfolio or conducting regular research without any cost.
Do I need an API key or coding knowledge to use it?
Absolutely not. Dividend Data is designed for simplicity and accessibility. There are no API keys to manage and zero coding required. After installing the add-in for Google Sheets or Microsoft Excel, you simply use the pre-built custom formulas just like any native spreadsheet function. The complexity is handled behind the scenes, delivering powerful data with a user-friendly experience.
What kind of data can I access with the spreadsheet functions?
You can access a vast array of data points crucial for investment analysis. This includes dividend information (amount, yield, ex-date, growth rate), real-time quotes, over 30 years of historical prices, complete financial statements (revenue, net income, assets, liabilities), and key valuation and profitability ratios (P/E, P/B, ROE, debt-to-equity). The functions are built to deliver specific metrics directly to your cell.
Is my data and portfolio information secure?
Yes. Dividend Data operates with a strong commitment to user privacy and security. Your spreadsheet data and portfolio lists remain within your Google or Microsoft ecosystem. The add-in fetches public market data but does not store or have access to the personal content of your spreadsheets. You maintain full control and ownership of your financial models and analysis at all times.
GrowPanel FAQ
How does GrowPanel integrate with billing platforms?
GrowPanel offers a one-click integration with popular billing platforms like Stripe, Chargebee, and Recurly. This seamless connection allows you to pull in data effortlessly, enabling instant access to your subscription metrics.
Is GrowPanel suitable for small businesses?
Absolutely! GrowPanel is designed to support businesses of all sizes. With its free tier available until you reach $200k ARR, it's an excellent choice for startups and small businesses looking for powerful analytics without the upfront costs.
What makes GrowPanel different from other analytics tools?
GrowPanel is specifically tailored for SaaS businesses, providing unique features such as cohort analysis, real-time tracking, and AI-driven insights that cater to the needs of subscription-based models. This focus sets it apart from general analytics tools.
Can I access GrowPanel on mobile devices?
Yes, GrowPanel is fully mobile-friendly. You can access all your dashboards and metrics on your phone, ensuring you stay informed and can make decisions on the go, without sacrificing functionality or depth of insight.
Alternatives
Dividend Data Alternatives
Dividend Data is a specialized financial data tool designed for investors who prioritize dividends and fundamental analysis. It delivers over three decades of market data directly into spreadsheets through simple formulas, eliminating the need for complex coding or manual updates. This places it in the category of self-service investment research platforms built for individual investors. Users often explore alternatives for various reasons, such as seeking different pricing models, requiring specific data points not covered, or needing integration with other platforms. Your unique investment strategy, budget, and technical comfort level will guide your search for the right tool. When evaluating options, focus on the depth and reliability of historical data, the simplicity of accessing it within your workflow, and the overall value. The best solution empowers your process without creating new obstacles, giving you more time for analysis and decision-making.
GrowPanel Alternatives
GrowPanel is a powerful subscription analytics platform designed specifically for SaaS companies. It provides users with real-time insights into key revenue metrics such as MRR, ARR, churn, and LTV, eliminating the chaos often associated with traditional spreadsheets. Users often seek alternatives to GrowPanel for a variety of reasons, including pricing structures, feature sets, or specific platform integrations that may better suit their unique business needs. When choosing an alternative, it’s essential to consider factors such as the ease of integration with existing billing systems, the comprehensiveness of analytics features, and the overall user experience. Look for platforms that not only provide valuable insights but also offer robust support and are tailored to the specific requirements of your business model.