StatPecker
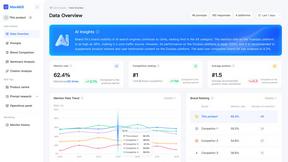
Transform your data into stunning, secure insights with AI instantly.
About StatPecker
StatPecker is your AI-powered partner for transforming raw data into compelling visual stories, designed to empower anyone to unlock the narrative hidden within their numbers. It eliminates the traditional barriers of data visualization: the hours of manual design, the high costs of professional artists, and the steep learning curves of complex software. By simply asking a question in plain English or uploading a CSV file, StatPecker's intelligent engine instantly analyzes your data and generates engaging, impactful infographics. This tool is built for the modern storyteller who needs to communicate with clarity and impact. Whether you are a content creator aiming to boost article engagement, a data analyst who must share insights without friction, a marketer crafting persuasive reports, or an educator making complex topics accessible, StatPecker amplifies your voice. It ensures your data makes the maximum impact, turning you into a master of data-driven communication. Start your journey to better storytelling today and see how your data can inspire, inform, and influence your audience with stunning clarity.
Features
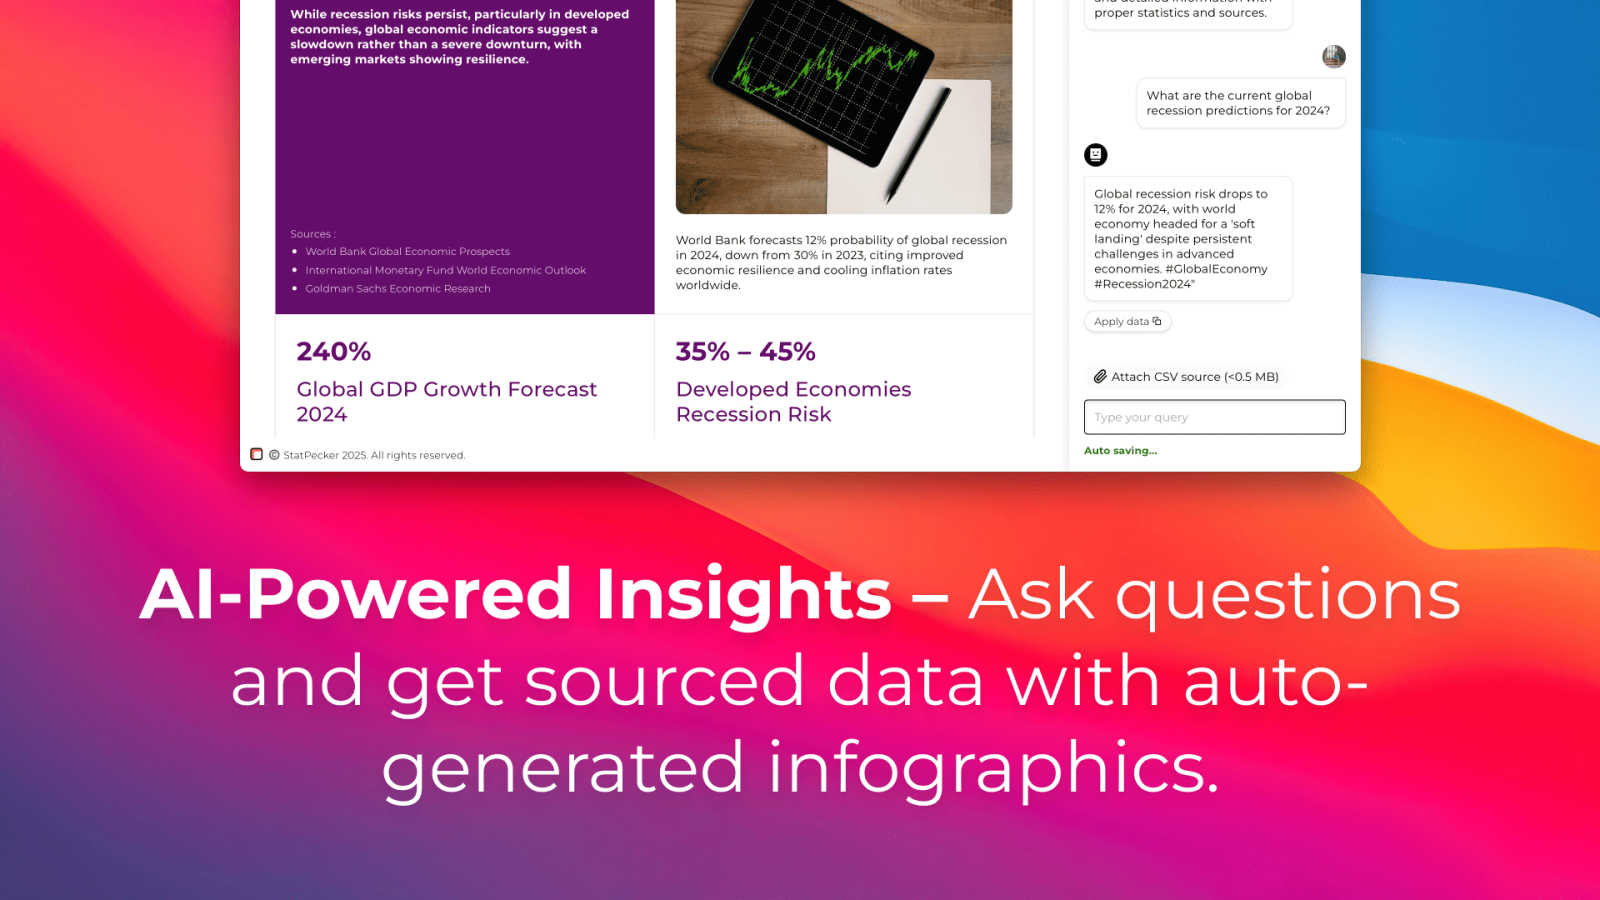
Ask Your Query
Get instant, credible insights by simply asking a question in natural language. StatPecker's AI queries validated sources to deliver answers, eliminating the need for complex tools or technical expertise. You can move from a question to a clear, visual answer in seconds, making data exploration intuitive and immediate for everyone.
Upload & Analyze CSVs
Extract key insights from your local data files with complete privacy. Upload a CSV (up to 50 MB) and explore it with questions. The Local SQL Agent runs everything directly on your device, ensuring your data never leaves your computer while it's prepared for analysis, keeping your sensitive information secure and under your control.
Publish & Embed
Seamlessly integrate your generated visuals into your workflow. StatPecker allows you to make your charts interactive and embed them directly into blogs, articles, websites, or internal dashboards. This feature turns your insights into a dynamic part of your content, enhancing engagement and professional presentation without any coding.
Download & Use Anywhere
Export your beautiful infographics as high-quality images ready for any platform. Download your visuals for use in reports, presentations, social media, or print materials. This flexibility ensures you can communicate your data story effectively wherever your audience is, maintaining visual consistency and impact across all mediums.
Use Cases
Content Creators & Bloggers
Content creators use StatPecker to transform dry statistics into engaging infographics that boost reader engagement and shareability. By visualizing data points from research or surveys, they can make their articles more persuasive and authoritative, turning complex information into accessible and compelling visual stories for their audience.
Business Analysts & Data Teams
Analysts leverage StatPecker to communicate insights quickly and clearly to stakeholders without friction. Instead of spending hours in complex BI tools, they can upload data, ask questions, and generate presentation-ready charts in seconds, streamlining the reporting process and ensuring key findings are understood and acted upon immediately.
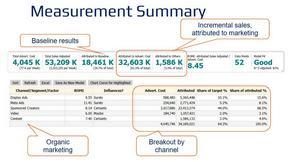
Marketing Professionals
Marketers craft persuasive reports and campaign summaries by visualizing performance metrics, customer demographics, and ROI data. StatPecker helps them create stunning visuals that tell a powerful story, making internal reviews and client presentations more impactful and driving data-informed decisions with compelling clarity.
Educators & Trainers
Educators use StatPecker to make complex topics and numerical concepts accessible to students. By turning datasets, historical trends, or scientific results into clear infographics, they enhance learning materials, foster better understanding, and engage learners with visual explanations that simplify and illuminate the subject matter.
Pricing
StatPecker offers straightforward pricing to empower your data storytelling journey. The Free Tier ($0) provides a robust starting point with unlimited projects, unlimited embeds with manual edits, 25 AI queries, and 10 CSV uploads. For users seeking unlimited power and lifetime access, the Lifetime Access plan is available for a one-time payment of $150 (with a limited-time 25% off at checkout). This plan grants lifetime access to all features, including unlimited projects & embeds, unlimited AI queries, unlimited CSV uploads, priority feature requests, and is backed by a 10-day, no-questions-asked refund policy.
Frequently Asked Questions
How does the Local SQL Agent ensure my data is private?
The Local SQL Agent is designed with privacy as the default. When you upload a CSV file, all processing and analysis occur directly on your device. Your data is prepared, queried, and visualized locally without ever being sent to external servers, ensuring your sensitive business or personal information remains completely secure and under your control.
What kind of questions can I ask StatPecker?
You can ask a wide range of data-related questions in plain English. For example, you can ask for trends, comparisons, summaries, or specific metrics like "Which regions drove the most revenue?" or "Show me sales over time." The AI interprets your intent and generates the appropriate SQL query and visual to answer your question clearly.
Can I edit the infographics after StatPecker creates them?
Yes, you have editing capabilities, especially for embeds. The 'Publish & Embed' feature allows for manual edits to the visuals you plan to integrate into your websites or blogs. This ensures you can fine-tune colors, labels, or other elements to perfectly match your brand guidelines and communication needs before sharing.
What are the limits of the Free Tier?
The Free Tier is a powerful starting point that includes unlimited projects and embeds with manual edits. It allows for 25 AI queries and 10 CSV uploads, giving you ample opportunity to explore the platform's core capabilities and create meaningful data stories without any initial cost or commitment.
Similar to StatPecker
InContekst
Decision support framework for high consideration businesses with mix of online and offline channels, content-rich sites, and long customer journeys.

Easymotion - AI Motion Graphic Generator
AI motion graphics and map animation generator. Create videos, charts, UI explainers, and map animations with AI.
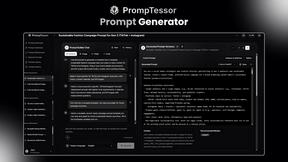
PrompTessor
Stop guessing with AI and start commanding it with PrompTessor, the all-in-one workspace to generate, optimize, and master every prompt for flawless.

Reelry
Reelry transforms your website into engaging, faceless TikTok reels, ideating and producing content that reflects your unique brand style.